Assessing a constituency before contesting takes five steps and six to ten weeks: classify every booth from past results, audit the voter roll, verify the swing booths on foot, run a baseline survey, and force an honest verdict. The scale is manageable because the units are small — a Tamil Nadu assembly seat averaged 321 polling booths of roughly 900 voters each in the 2026 election (75,064 stations across 234 seats, ECI, April 2026). Our constituency analysis framework explains what each data layer is; this manual is the execution version — what to download, what to build, and what “done” looks like at every step.
Key Takeaways
- Five steps in strict order: booth classification → roll audit → field verification → baseline survey → verdict. Each step tells the next where to look.
- Step 1 is free: Form 20 booth-wise results from your state CEO’s website. In most seats, under a third of booths are genuinely in play — find yours before spending a rupee.
- Plan 6-10 weeks end to end; field verification and survey work can overlap from week 4.
- The output is a contest/don’t-contest verdict with a booth-level vote path — not a feeling.
What Does Assessing a Constituency Actually Involve?
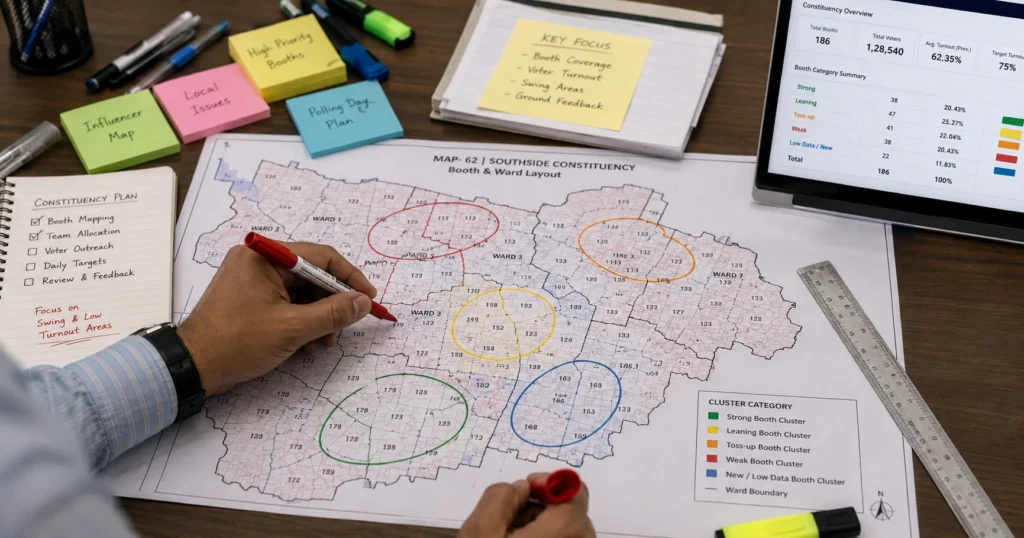
Converting a seat from a name into a spreadsheet. India’s 2024 general election ran on 10.51 lakh polling stations averaging 931 electors each (ECI granular data release, December 2024), and a constituency assessment treats your seat as what it really is: a few hundred of those micro-electorates, each with its own recorded history.
Before starting, gather the raw materials — they’re the same five layers in our
pre-nomination data checklist: Form 20 result sheets for the last two elections, the current electoral roll, and a notebook that will become your community map. Steps 1 and 2 are desk work anyone can start this week. Steps 3-5 need feet, a small team, and method.
Step 1: How Do You Classify Booths From Form 20?
Download Form 20 — the booth-wise result sheet — for your constituency from your state Chief Electoral Officer’s website; every state publishes it after each election. Build one spreadsheet row per booth per election, then classify each booth into four buckets using two cycles of data.
| Class | Rule of Thumb (2 cycles of Form 20) | Campaign Treatment |
|---|---|---|
| Stronghold | Your side won both cycles by a wide, stable margin | Turnout maintenance only |
| Lean | Won both cycles, but the margin narrowed | Defend; find out what’s eroding |
| Swing | Flipped between cycles, or decided by a thin margin either way | Full persuasion + field verification (Step 3) |
| Hostile | Lost both cycles by wide margins | Minimal spend; dignity presence only |
One warning for 2026-cycle work: Tamil Nadu’s turnout jumped from 74.26% to 85.1% in the April 2026 election (ECI results, May 2026). After a surge like that, single-cycle classifications mislead — weight the 2026 numbers, but treat any booth whose behaviour changed sharply as swing until Step 3 proves otherwise.
Step 2: How Do You Audit the Voter Roll?
Pull the current electoral roll for every booth — the ECI publishes them per polling station — and run three comparisons against the roll used in the last election: additions (first-time and newly moved voters), deletions, and inter-booth migrations. The roll moves more than most candidates expect; Tamil Nadu’s 2026 Special Intensive Revision settled the state’s electorate at 5.67 crore voters (ECI SIR, February 2026) after large-scale corrections.
The output is one number per booth: what share of today’s voters have no voting history at this booth. Below 10%, your Step 1 classification holds. Above 20%, the booth’s history is diluted — treat it as swing regardless of what Form 20 says. This single number is the cheapest correction you’ll ever apply to a constituency model.
A roll audit also produces your first campaign asset: the first-time voter list by booth. New voters have no habit to break — and after a turnout surge like 2026’s, they’re the largest unclaimed bloc in the seat.
Step 3: How Do You Verify Swing Booths on Foot?
Walk them — all of them. With 25-35% of an average seat’s ~321 booths in the swing bucket, that’s typically 80-110 booths. A two-person team covering four to six booths a day completes the sweep in three to four weeks, overlapping with Step 4. Desk data flagged these booths; only the ground explains them.
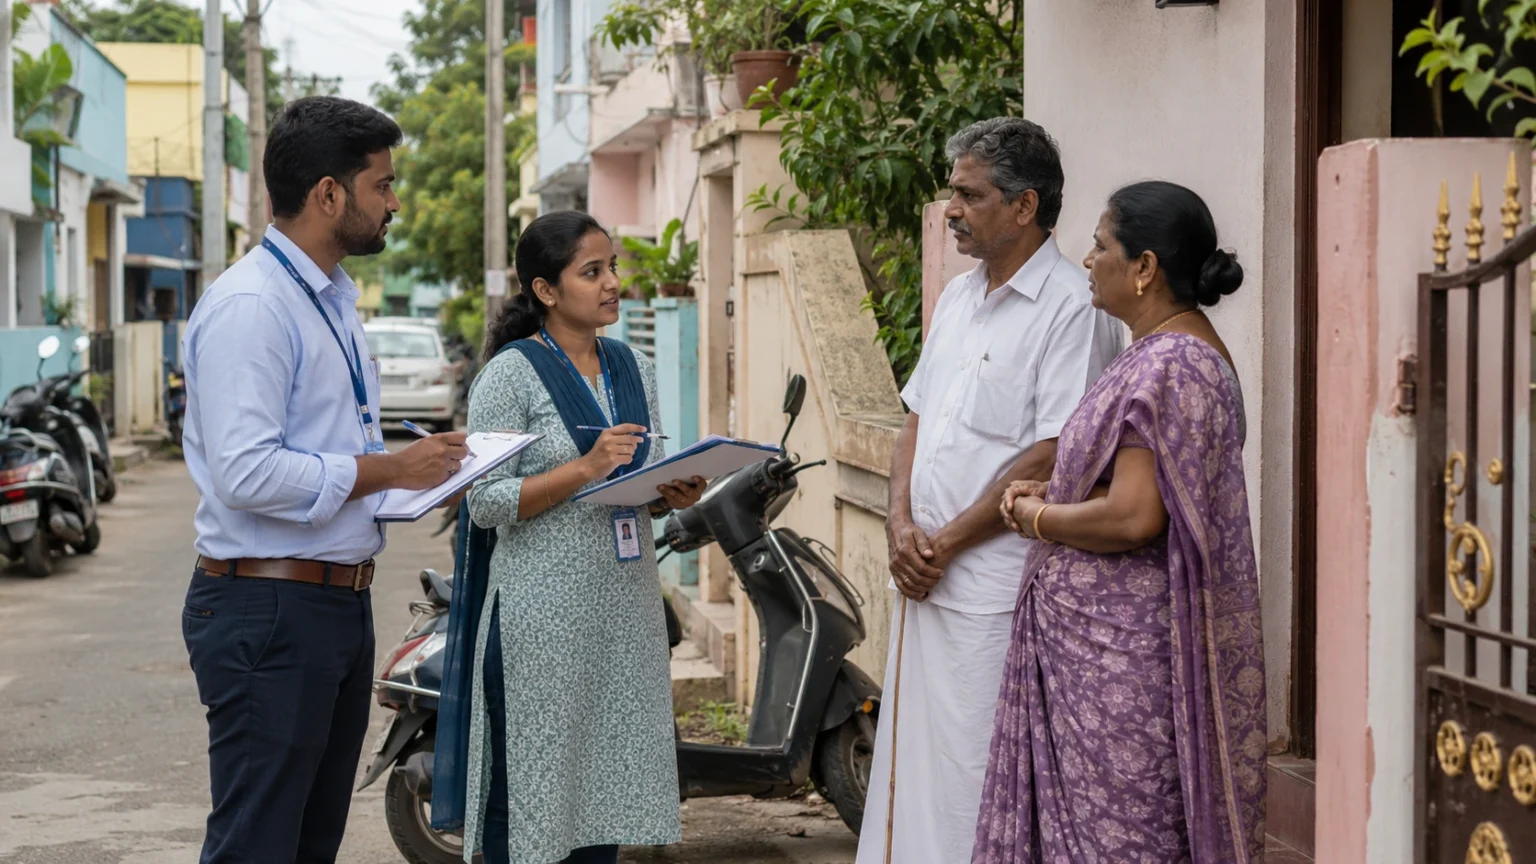
At each booth, the team documents four things: the actual streets and habitations the booth covers (roll boundaries surprise everyone), the community and occupation clusters, the named local influencers — association heads, temple or mosque committee members, SHG leaders, youth club organisers — and the one grievance residents mention unprompted. That last item becomes message raw material later.
Step 4: How Do You Run the Baseline Survey?
Commission a structured sample survey across booth clusters — not a straw poll at your own meetings. For a standard 1.8-2.4 lakh voter assembly seat, professional practice samples proportionally across all booth classes, weighted toward swing clusters, measuring four things: name recognition, party lean, issue salience, and willingness to switch.
Timing matters as much as design. The survey runs after Steps 1-3 so its sample frame reflects the real booth map, not administrative averages. And it must respect the legal line: opinion surveys are prohibited only in the final 48 hours before polling closes (Section 126A, Representation of the People Act) — a properly timed pre-campaign survey is fully compliant. This step is usually where candidates bring in professional help; our
voter analysis service pairs the survey with the booth model the earlier steps produced.
Step 5: How Do You Reach an Honest Verdict?
Force the assessment to output three numbers: the realistic vote target (from turnout and past totals), the identified path to that target (which booth classes and communities supply the votes), and the budget that path implies. If the path requires flipping booths your survey says are immovable, the verdict is “not this seat” — or “not this cycle.”
The verdict also decides what happens next. A “contest” verdict flows straight into structure: the booth-class map becomes the deployment plan for
booth management, the survey becomes the message architecture, and the influencer list becomes the outreach calendar.
How Long Does a Constituency Assessment Take?
Six to ten weeks, with deliberate overlap from week 4. The sequence below assumes a standard assembly seat and a small professional team; solo candidates doing Steps 1-2 themselves should add two weeks. The full timing logic — and why this must finish before D-90 on the election countdown — is in our
when to hire an election consultant guide.
Want the Assessment Done Properly?
Sivakumar and the Think Politically team run this exact five-step assessment for Tamil Nadu aspirants — booth classification through verdict. Book a free 30-minute scoping call: we’ll tell you what’s already downloadable for your seat, what must be built, and whether your timeline still allows the full sequence.
Frequently Asked Questions
How do you assess a constituency before contesting an election in India?
Five steps over 6-10 weeks: classify every booth from two cycles of Form 20 results, audit the voter roll for additions and migrations, verify swing booths on foot, run a structured baseline survey, and force a contest/don’t-contest verdict with a booth-level vote path. Steps 1-2 are free desk work; steps 3-5 need a field team.
Where do I get booth-wise election results for my constituency?
From your state Chief Electoral Officer’s website — every CEO publishes Form 20, the booth-wise result sheet, after each election. With India’s 10.51 lakh booths averaging 931 voters (ECI, 2024), Form 20 is the highest-resolution public dataset in Indian elections, and it costs nothing.
How many booths do I need to physically visit?
The swing bucket only — typically 25-35% of a seat’s booths, or 80-110 of the ~321 booths in an average Tamil Nadu assembly constituency. A two-person team covering 4-6 booths a day finishes in three to four weeks. Strongholds and hostile booths don’t repay walking time at the assessment stage.
What makes a constituency winnable?
A realistic vote target with an identified path: enough reachable votes across swing booths, first-time voters, and soft supporters of the incumbent to cross the winning threshold — plus a budget that can fund that path. If the survey shows the required booths are immovable, the honest verdict is a different seat or a different cycle.
Can I do a constituency assessment myself?
Steps 1 and 2, yes — Form 20 classification and a roll audit need a laptop and patience. Steps 3-5 need trained enumerators, survey design, and analysis discipline; that’s typically 6-8 weeks of professional fieldwork. Many candidates do the desk work themselves and commission the field layers.
How do you identify local issues and voter grievances before contesting an election?
\n Local issue identification typically combines structured field surveys asking open-ended questions about the biggest problems in each area, with informal conversations at the booth or ward level that surface grievances a formal survey might miss. Mapping these issues by booth cluster, rather than treating the constituency as having one uniform set of concerns, is what lets a campaign message differently across different parts of the same seat.\n
Start With the Free Steps — This Week
Everything in this manual flows from a spreadsheet you can start building today. Download Form 20 for your seat, classify your booths, and you’ll know more about your constituency by Friday than most declared candidates learn by nomination day.
Then decide how far to take it. The full framework — all five data layers and how they fit together — is in our
constituency analysis in India guide, and the paperwork side lives in the
pre-nomination data checklist. The seat you want deserves the assessment before it gets the announcement.
Sources: Election Commission of India via PIB, “ECI Releases Granular Data of Lok Sabha Elections 2024” (10.51 lakh polling stations; 931 average electors per station), December 2024, retrieved 2026-07-07, pib.gov.in · ECI, General Elections to Tamil Nadu Legislative Assembly 2026 (75,064 polling stations across 234 seats; 85.1% turnout; SIR electorate 5.67 crore), April-May 2026, retrieved 2026-07-07, eci.gov.in · Representation of the People Act 1951, Section 126A (survey restriction window).
About the author: Sivakumar Devasagayam is Campaign Strategy Lead at Think Politically, a Chennai-based political consulting firm focused on Tamil Nadu state and local elections. He has worked on assembly and Lok Sabha campaigns across Kongu, Delta, and Chennai urban constituencies since 2011.