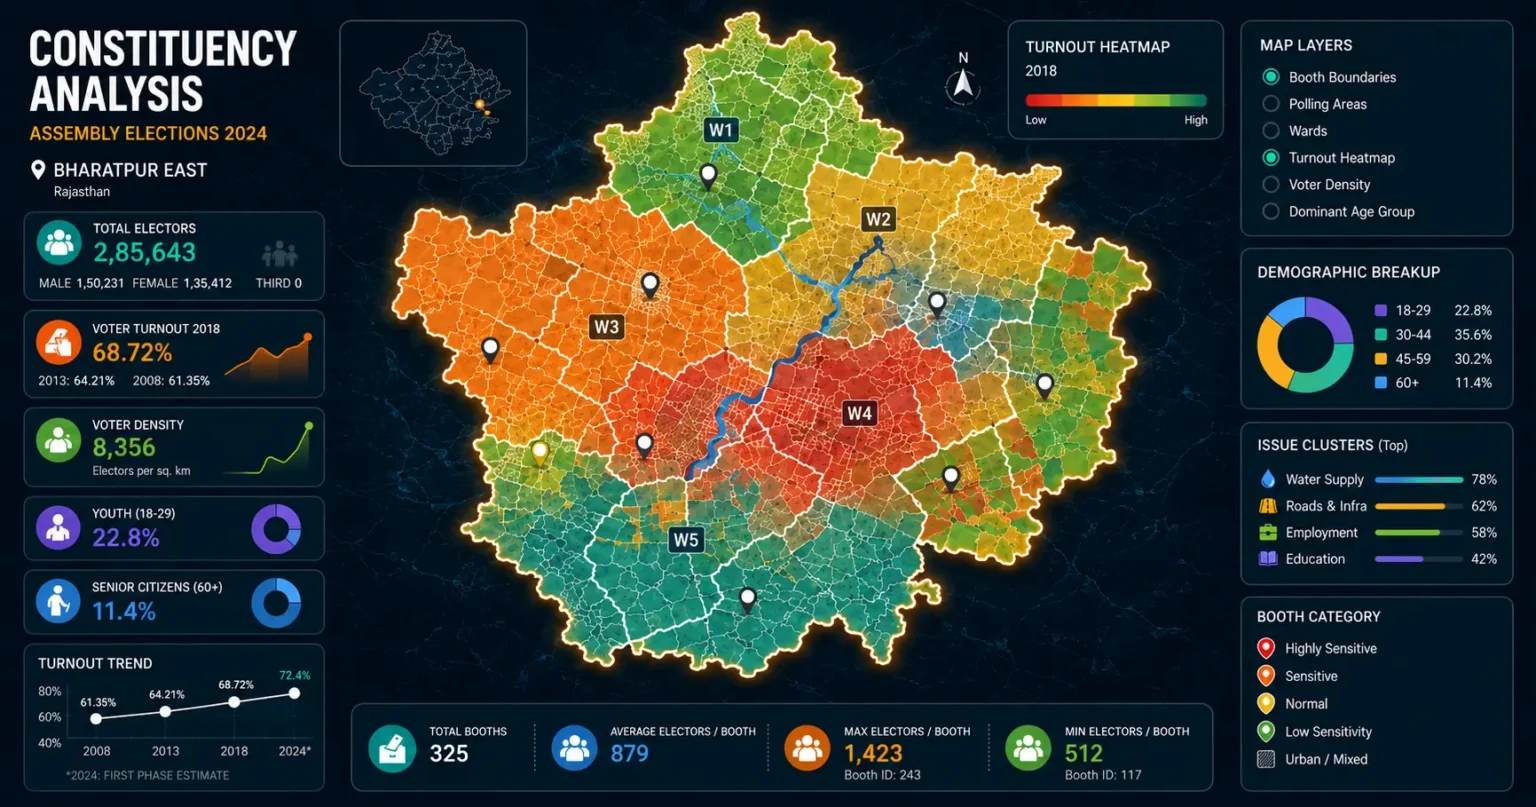
Constituency analysis is the systematic study of a seat’s voters, booths, communities, and past results before you commit to contesting it. India’s electorate is vast — the Election Commission counted 97.79 crore registered electors across 10.51 lakh polling stations in the 2024 general election (ECI granular data release, December 2024) — but elections aren’t won at that scale. They’re won booth by booth, in units of roughly 900 voters each. This guide gives you the complete five-layer framework we use to assess a constituency: the data to collect before filing nomination, how to read booth-level patterns, how community mapping actually works, and when to commission the work.
Voter analysis is where most candidates start; constituency analysis is the discipline that tells you whether to start at all.
Key Takeaways
- Constituency analysis has five layers: electoral history, voter roll structure, booth demographics, community geography, and issue mapping. Skip one and the others mislead.
- A Tamil Nadu assembly seat averages ~321 polling booths (75,064 stations across 234 seats, ECI 2026) — constituency averages hide the booth-level swings that decide close seats.
- The 2026 TN election proved assumptions expire: turnout jumped from 74.26% to 85.1% and a first-time party won 108 seats. Pre-2026 voter models are already obsolete.
- Collect the data BEFORE filing nomination — parties increasingly allocate tickets based on winnability evidence, not seniority.
What Is Constituency Analysis in India?
Constituency analysis is a pre-campaign intelligence exercise that answers three questions: can this seat be won, by whom, and with what coalition of booths and communities. In 2024, India averaged 931 electors per polling station (ECI, Lok Sabha 2024 statistical review) — which means every assembly constituency is really a federation of a few hundred micro-electorates, each with its own history and lean.
According to the Election Commission of India’s 2024 data release, the country’s 97.79 crore electors vote across 10.51 lakh polling stations — roughly 931 voters per booth (ECI/PIB, December 2024). Professional constituency analysis works at that booth resolution, because a seat that looks lost on averages is often winnable on distribution, and vice versa.
Who needs it? Three groups. Aspirants deciding whether and where to contest. Ticket-seekers who must prove winnability to their party. And confirmed candidates who need a plan that allocates money and volunteers to the booths that can actually change the result — not the ones that feel loudest.
What Data Should a Candidate Collect Before Filing Nomination?
Before filing nomination, a serious candidate should hold five data layers: two elections of booth-wise results, the current voter roll with additions and deletions, a booth-level demographic map, a community/occupation profile, and a baseline survey. India’s rolls move constantly — Tamil Nadu’s 2026 Special Intensive Revision alone settled the state’s electorate at 5.67 crore voters before polling (ECI SIR, February 2026) — so stale data is wrong data.
| Layer | What You Collect | Primary Source |
|---|---|---|
| 1. Electoral history | Booth-wise results, last 2-3 elections (Form 20) | CEO website of your state |
| 2. Voter roll structure | Current roll, first-time voters, deletions, migrations | ECI electoral rolls (PDF, per booth) |
| 3. Booth demographics | Age bands, gender ratio, household clusters per booth | Roll analysis + field verification |
| 4. Community geography | Caste/community and occupation clusters by area | Field enumeration (no public dataset exists) |
| 5. Issue map | Ward-level grievances, local works, influencer network | Baseline survey + panchayat/ward records |
Layer 1 is free and public: Form 20 booth-wise results are published by every state Chief Electoral Officer after each election. Layers 2 and 3 come from the electoral roll, which the ECI publishes per booth. Layers 4 and 5 can’t be downloaded — they’re built by structured fieldwork, which is what a
pre-election constituency survey actually produces.
How Do You Assess a Constituency Before Contesting?
The assessment runs in five steps over six to ten weeks: history first, roll second, field third, survey fourth, verdict last. Order matters — each step tells the next one where to look. Rushing to a survey without booth history is how campaigns buy expensive answers to the wrong questions. The step-by-step field manual for this sequence is in our how to assess a constituency before contesting guide.
Step 1: Read the last two elections booth by booth
Pull Form 20 for the previous two elections and classify every booth: stronghold, lean, swing, or hostile. In a typical seat, under a third of booths are genuinely in play. That’s your battlefield — the rest is turnout maintenance.
Step 2: Audit the voter roll
Compare the current roll against the last election’s. First-time voters, deletions, and inter-booth migrations tell you how much of the old result still applies. A booth that added 20% new voters since the last cycle isn’t the same booth.
Step 3: Walk the swing booths
Field teams verify what the paper says: which streets a booth actually covers, which communities live there, who the local influencers are. Desk analysis identifies the swing booths; only fieldwork explains them.
Step 4: Run a baseline survey
A structured sample survey across booth clusters measures name recognition, party lean, issue salience, and willingness to switch. This is the layer that converts a map into a strategy.
Step 5: Deliver the verdict
The output is a winnability assessment: the realistic vote path, the coalition of booths and communities it requires, the budget that path implies, and the risks that could break it. Sometimes the honest verdict is “don’t contest this seat — contest that one.”
This is the assessment sequence in our own D-90 intake; the timing logic behind it is covered in our guide on
when to hire an election consultant.
Why Booth-Level Mapping Beats Constituency Averages
Because the constituency average is a fiction. Tamil Nadu’s 2026 election ran on 75,064 polling stations across 234 assembly seats (ECI, April 2026) — about 321 booths per seat. A candidate polling 42% “on average” is usually polling 65% in some booths and 18% in others. Strategy lives in that spread, not in the average.
Booth mapping also disciplines spending. A typical 1.8 lakh voter assembly seat needs 12,000-15,000 verified voter contacts to build a working segmentation model. Concentrating that collection in swing booths costs a fraction of blanket canvassing and produces data you can act on. It’s the same logic that drives
booth management on polling day — the campaign that mapped booths first is the one that can staff them last.
How Does Caste and Community Mapping Work Without Public Data?
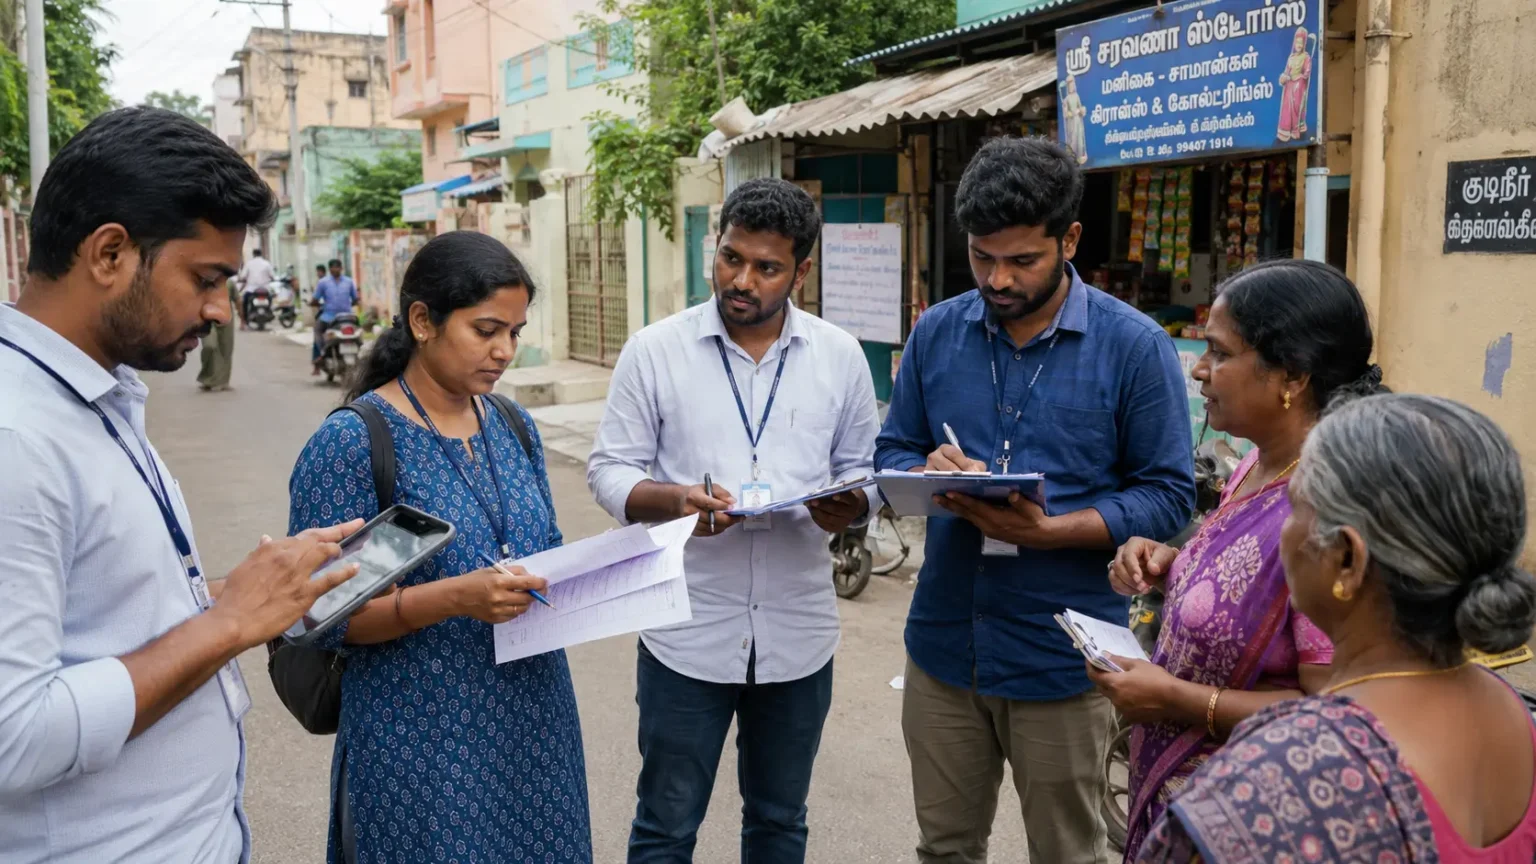
There is no public caste dataset at booth level in India — the last full caste census published was in 1931, and modern surveys report at state or district level only. So community mapping is built, not downloaded: trained enumerators classify household clusters street by street, using the voter roll as the frame and local verification as the method.
Handled properly, this mapping is descriptive, not divisive — it tells you where to listen harder, which grievances are cluster-specific, and where your message needs translation into a community’s own priorities. In Tamil Nadu, where sub-caste geography shifts block by block between Kongu, Delta, and southern districts, imported national templates simply don’t survive contact with the ground. The full method — the data gap, the enumeration walks, and the legal line — is in our caste composition of a constituency guide.
What Did the 2026 Tamil Nadu Result Teach About Stale Assumptions?
That every pre-2026 voter model in the state is now obsolete. In April 2026, Tamil Nadu’s turnout jumped to 85.1% from 74.26% in 2021 — nearly 11 points — and TVK, a party contesting its first election, won 108 seats with 34.92% vote share (ECI results, May 2026). The state got its first hung assembly, and Vijay became Chief Minister through a post-poll coalition with Congress.
Read that as a constituency analyst and one lesson dominates: the 10.84-point turnout surge means roughly one voter in nine at every booth had no 2021 voting record at all. Add first-time voters and a first-time party, and booth histories older than one cycle lost predictive power overnight. Our
2026 Tamil Nadu election data findings unpack the booth-level patterns in detail.
The practical consequence for anyone eyeing the delayed local body polls or building toward 2031: re-baseline now. Fresh Form 20 data from 2026 is the new layer 1, and the electorate it describes is measurably different from the one your last campaign knew. The playbook in our guide on
how to win a Tamil Nadu assembly election starts from exactly this re-baselining step.
When Should You Commission a Constituency Analysis?
Twelve to eighteen months before expected polling day, and never later than D-90. The full five-layer assessment takes six to ten weeks end to end — data collection alone runs 6-8 weeks for a typical 1.8 lakh voter seat — and its biggest payoffs (ticket positioning, seat selection, early narrative) only exist if the work finishes before the campaign starts.
Cost scales with depth: a desk-only historical review is cheap; a full five-layer assessment with baseline survey is a serious engagement priced by seat size and competitiveness. Either way, it’s a fraction of what campaigns burn correcting a misread constituency in the final month. The timing logic — and what becomes impossible after D-60 — is covered in our
when to hire an election consultant timeline guide.
Get a Free Constituency Assessment Scoping Call
Thinking about a seat for the local body polls or the next assembly cycle? Sivakumar and the Think Politically team offer a free 30-minute scoping call for Tamil Nadu aspirants. We’ll tell you what data already exists for your constituency, what has to be built, and what a realistic assessment looks like — no obligation, no templated pitch.
Frequently Asked Questions
What is constituency analysis in Indian elections?
Constituency analysis is the pre-campaign study of a seat’s booth-wise voting history, voter roll structure, demographics, community geography, and local issues. India’s 10.51 lakh polling booths average just 931 voters each (ECI, 2024), so professional analysis works at booth resolution rather than constituency averages.
What data should a candidate collect before filing nomination in India?
Five layers: booth-wise Form 20 results from the last two elections, the current voter roll with additions and deletions, booth-level demographics, a community and occupation map built by fieldwork, and a baseline survey. The first two are free from your state CEO’s website and the ECI; the rest are built on the ground.
How long does a full constituency assessment take?
Six to ten weeks for a typical 1.8 lakh voter assembly seat: roughly two weeks of desk analysis on results and rolls, 6-8 weeks of overlapping field data collection, and a structured baseline survey. That’s why the work must start well before D-90 on the election countdown.
Is booth-wise election data publicly available in India?
Yes. Form 20 — the booth-wise result sheet for every constituency — is published by each state’s Chief Electoral Officer after every election, and the ECI publishes electoral rolls per polling station. What’s not public is demographic or caste data at booth level; that layer must be built through field enumeration.
How much does a pre-election constituency survey cost in Tamil Nadu?
It depends on sample size, booth coverage, and whether it’s bundled with the full five-layer assessment. Voter-level data collection for a standard assembly seat runs ₹4-6 lakh before analysis. A scoping call is the fastest way to a real number for your specific seat — every constituency prices differently.
How do you calculate win number and model vote share for an assembly seat in India?
Win number modelling starts from the same booth-wise Form 20 data used in constituency analysis: project each booth’s likely turnout, apply the vote-share shifts the baseline survey and community mapping suggest, and sum across all booths to get a projected vote total. That total, compared against a similarly modelled projection for the strongest rival, is the win number the campaign needs to beat. In a genuine multi-cornered contest the required share can be well under 50%; in a clean two-way fight it is usually just above half, so the model has to reflect how many serious contestants are actually splitting the field in that specific seat, not a statewide assumption.
What is community-wise vote share modelling?
Community-wise vote share modelling estimates how each major community or caste group in a constituency is likely to vote, based on historical booth-level results cross-referenced with community composition data. It lets a campaign see which communities its message is actually landing with, rather than relying on an aggregate vote-share number that can mask sharp differences between segments.
What is booth-level voter demographic mapping in India?
Booth-level demographic mapping breaks the electoral roll down to individual polling stations and layers age, gender, community, and locality-type data onto each one, producing a demographic profile per booth rather than a single constituency-wide average. This resolution is what lets a campaign target specific booths with tailored messaging instead of a uniform constituency plan.
What is constituency voter mapping?
Constituency voter mapping is the process of plotting the electorate geographically and demographically across every booth in a seat, combining electoral roll data, past results, and field intelligence into a single picture. It is the foundation that later analysis, community modelling, swing identification, issue mapping, is built on top of, since none of that later work is reliable without an accurate base map first.
What is a pre-poll constituency study?
A pre-poll constituency study is the research phase a campaign runs before committing resources: reviewing booth-wise historical results, auditing the current voter roll, and fielding a baseline survey to establish where the seat genuinely stands. It answers the question of whether, and how, a seat is winnable before the campaign spends money assuming an answer.
How do you conduct a pre-election constituency survey for assembly candidates?
Start with a sample sized for the constituency’s voter base (typically 800-1,200 respondents for a standard assembly seat), stratify it to match the actual community composition of each booth cluster, and field it 60-90 days before polling day so there is still time to act on the findings. The survey should measure vote-share by segment, issue salience, and candidate favourability, not just a single top-line preference number.
What is demographic voter profiling for assembly elections in India?
Demographic voter profiling segments a constituency’s electorate by age, gender, community, and locality type, then overlays historical voting behaviour onto each segment. This produces a profile of which specific groups are moving toward or away from a candidate, information an aggregate vote-share figure cannot provide on its own.
What is local issue identification and mapping for a constituency in India?
Local issue identification and mapping catalogues the specific grievances and priorities voters raise by ward or booth cluster, water supply in one area, road access in another, scheme delivery gaps in a third, rather than assuming a single set of state-level issues applies uniformly. Mapping these locally lets a campaign tailor messaging block by block instead of running one generic issue platform across the whole constituency.
Map the Seat Before You Fight for It
Constituency analysis is the cheapest insurance in Indian politics. Every rupee of campaign spend that follows it lands harder, and every assumption it kills before nomination day is a mistake you didn’t fund. The 2026 Tamil Nadu result was a masterclass in what happens to campaigns running on expired maps.
Start with what’s free: pull your constituency’s Form 20, classify your booths, audit the roll. Then decide — with evidence — whether the seat is yours to win. And if you want the full five-layer picture, commission it while there’s still time to act on what it finds.
Sources: Election Commission of India via PIB, “ECI Releases Granular Data of Lok Sabha Elections 2024” (10.51 lakh polling stations; 97.79 crore electors; 931 average electors per station), December 2024, retrieved 2026-07-07, pib.gov.in · ECI, General Elections to Tamil Nadu Legislative Assembly 2026 (75,064 polling stations; SIR electorate 5.67 crore; results and 85.1% turnout), April-May 2026, retrieved 2026-07-07, eci.gov.in / results.eci.gov.in · ECI, Tamil Nadu assembly results 2021 (74.26% turnout).
About the author: Sivakumar Devasagayam is Campaign Strategy Lead at Think Politically, a Chennai-based political consulting firm focused on Tamil Nadu state and local elections. He has worked on assembly and Lok Sabha campaigns across Kongu, Delta, and Chennai urban constituencies since 2011.